- Top left number “1” – layer content – ↑ ↓
Curve sequence:
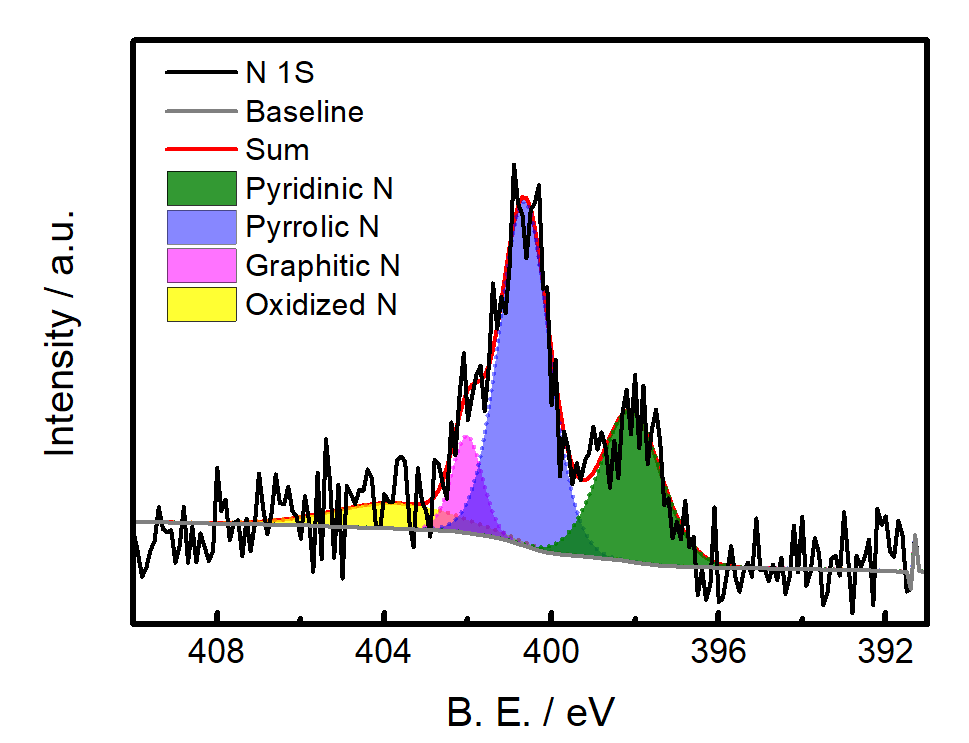
1. N line 1, filled
Fill Area Under Curve- Normal (blue, transparency 53%)
2. N line 2, filled
Fill Area Under Curve- Normal (olive, transparency 20%)
…(more line)
3. baseline, white line , Fill Area Under Curve- Normal (white)
4. raw data
5. sum for splitted peaks
6. baseline, gray
- Plot details, layer properties-Display- remove check of “data on top of axes”


专业。
「不要挣扎,她就是记录一下,你们看不懂的」
@Temple哈哈哈,自己记一下,也是给能搜到的人用的
因为我查到的一些解决方案不是很完美
很好的绘图软件,看了下知乎教程,才知道那些好看的图形是怎么绘制出来的了。
@夜未央一般data都用这个画,数据点上千的话excel会卡
当然会mathematica或者python就另说了
使用颜色渐变,感觉会更加漂亮~
@白山黑水不太喜欢渐变,扁平化时代纯色才是主流